- Bitcoin retests $40,000 support while recovery above $42,000 seems shaky.
- Cardano holds marginally above $2, but a breakdown to $1.5 still lingers.
The cryptocurrency market value is back under $2 trillion and precisely holding at $1.97 trillion following a selloff that has persisted since Sunday. Bitcoin has explored levels close to $40,000 after hitting highs close to $49,000 on Friday last week.
advertisement

The rest of the market is deeply in red while dealing with the ravaging bearish wave. Ethereum can barely hold above $3,000 following a correction from areas past $3,600 last week. As reported earlier, Ripple extended the bearish leg to $0.86 but has recovered to $0.94 while bulls reach out for $1.
Bitcoin:-
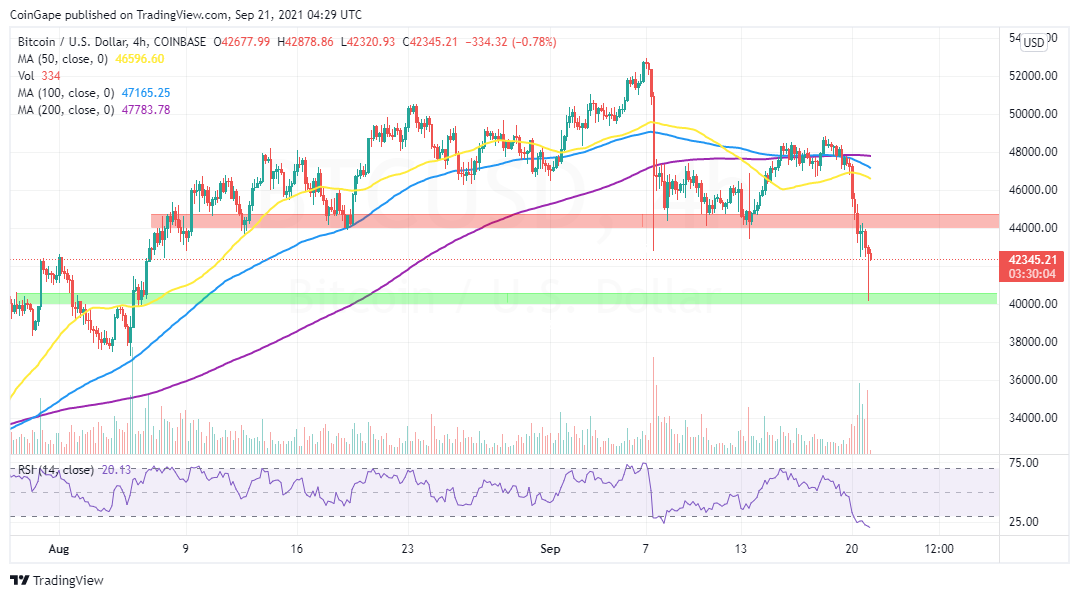
Bitcoin is back on the drawing board after losing ground at the previous demand zone around $44,000. The bearish outlook poked more holes in BTC’s boat, resulting in another dip that took a pit stop in the demand zone marginally above $40,000.
Meanwhile, the flagship cryptocurrency is trading at $42,434 amid a bearish building momentum. If the immediate support at $42,000 shatters, a return to $40,000 is plausible. However, buyers are expected to put up an intense fight at this level to prevent BTC from exploring areas below $40,000.
Realize that the bellwether cryptocurrency is already oversold based on the Relative Strength Index (RSI) position. Although the oversold conditions are within a short timeframe (four-hour), they often suggest a recovery in the cards.
Keep in mind that the demand tuned supply zone at $44,000 will create a formidable overhead barrier as Bitcoin makes its way toward $50,000 again.
BTC/USD Four-Hour Chart
Cardano:-
Cardano has continued to lose ground since trading an all-time high of $3.15 on September 2. The platform that recently achieved the smart contract support status is trading slightly above $2 but had earlier touched $1.91, levels not seen since August 19.
The addresses in the supply zone at $2 seem to be focused on averting further losses. However, there is a possibility that Cardano will dive deeper. A daily close under $2 would trigger immense sell orders, raising overhead pressure. In this case, Cardano will close the gap to the next key demand zone at $1.5.
ADA/USD Daily Chart

The 100-day Simple Moving Average (SMA) is in place to provide the much-needed support, preventing ADA from dropping to $1.5. Nonetheless, the demand zone at $1.5 is the most robust buyer congestion zone, reinforced by the 200-day SMA.