- Ripple climbs to $1 after falling to $0.86 earlier this week.
- A confirmed break above $1 will add credence to the bullish narrative; more resistance is expected at $1.2.
The cryptocurrency market is making a comeback after dealing with volatility since last Sunday. Investors have been cautious in the last few days, especially with Evergrande’s financial saga overhanging.
advertisement

However, nearly all cryptos are in the green, with some altcoins posting impressive double-digit gains. For instance, Polkadot is up 17% to trade $32, while Solana is trading at $150 following a 16% growth in 24 hours.
As discussed earlier, Bitcoin has rebounded from $40,000 and settled above $44,000. A confirmed breakout past $45,000 will likely affirm the uptrend to $48,000. Similarly, Ethereum has lifted to trade at $3,125 after revisiting lows of $2,650 for the first time since early August.
Ripple:-
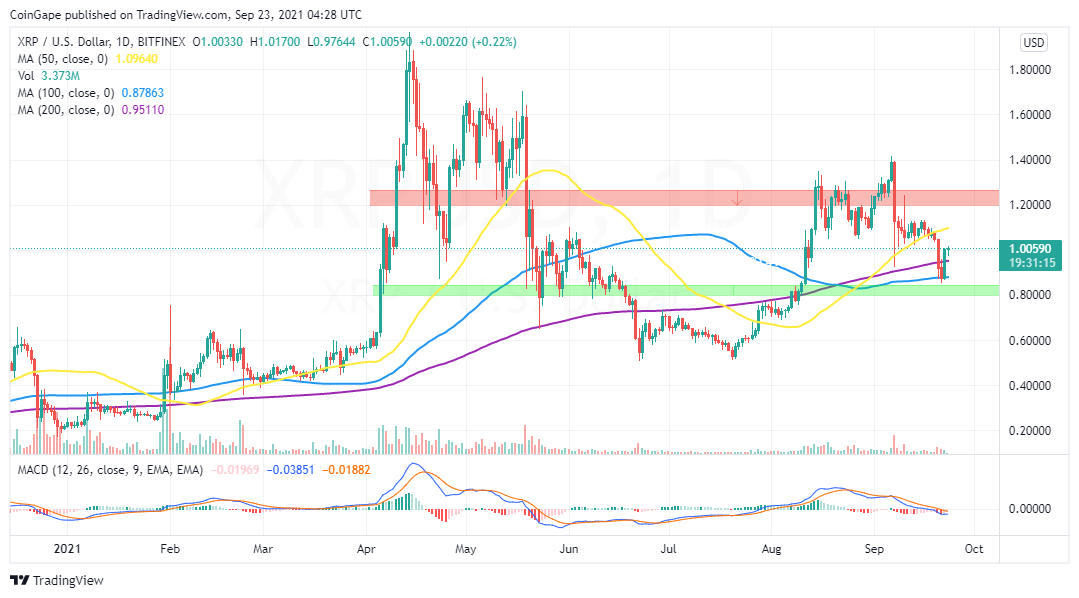
Ripple defended support at $0.86 and later settled above $0.9 after running into robust resistance at $0.95. The ability to hold support provided by the 100-day Simple Moving Average (SMA) ensured the transition to stability on Wednesday.
Investors took advantage to buy the dip, bolstering XRP past the hurdle at the 200-day SMA around $0.95. The cross-border money transfer token later extended the bullish leg to $1 and is currently trading at $1.004.
As bulls regain ground, higher support must be defended, preferably above $1 for XRP. Only a confirmed breakout beyond this level will validate the upswing to $1.2. Note that a larger seller congestion zone is anticipated at $1.2, which may delay or sabotage the desire to lift Ripple above $1.4.
Investors should keep in mind that the MACD is still rolling below the mean line. The uptrend will be cemented as the 12-day EMA crosses above the 26-day EMA.
XRP/USD Daily Chart
Solana has not been left behind by the bullish wave crisscrossing the market. This smart contracts token had suffered a setback to $116 considering that it traded new record highs at $214 on September 7.
The 38.2% Fibonacci retracement level contributed to the support, marking the beginning of the ongoing recovery. Solana bulls seem to have done the most, perhaps propped by investors who bought the dip.
At writing, SOL is teetering at $148 amid a battle to settle above $150. The 61.8% Fibonacci level caps the upside. Solana must close the day above this line to validate the uptrend to $170.
SOL/USD Daily Chart
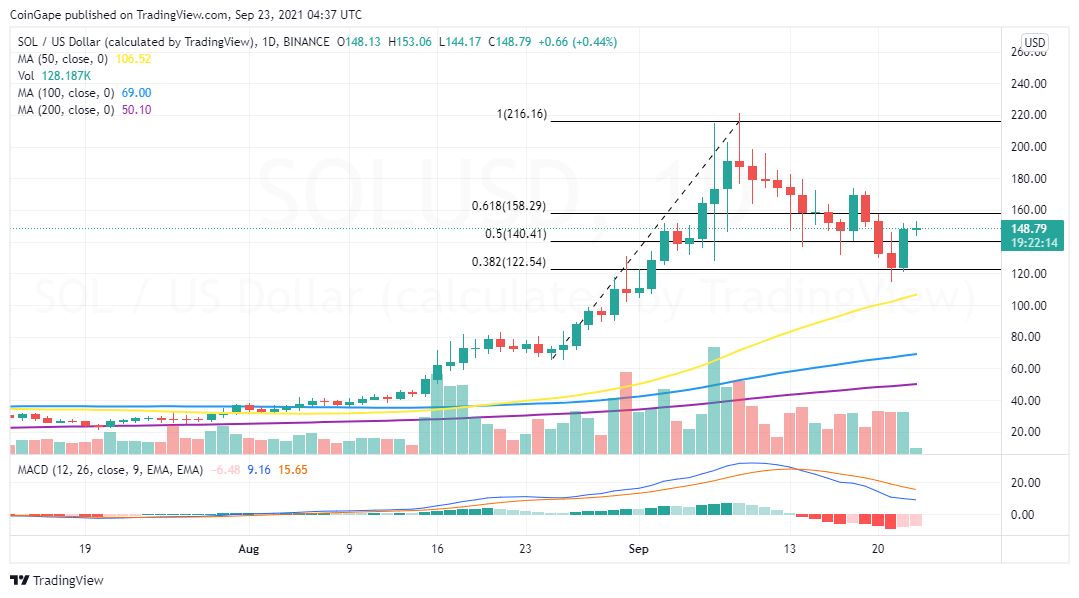
If push comes to shove and selling pressure intensifies, Solana will seek support at the 50% and 38.2% Fibonacci levels. Traders cannot ignore the still bearish MACD, and therefore, caution cannot be overemphasized.