Bitcoin price is currently hovering around $65,524 with a bullish bias after successfully bounding off the $62,000 coincinding with the 50-period Simple Moving Average (SMA) support wall on November 13. The bullish momentum is set to continue as the developments around the Taproot soft fork upgrade come into focus.
Taproot Upgrade To Fuel BTC’s Uptrend
Bitcoin (BTC) turned away from the all-time high (ATH) around $69,034 in the past week due to profit-taking and capital rotation from the big cryptocurrencies into undervalued altcoins. In addition, BTC’s setback was also fueled by the Securities and Exchange Commission’s (SEC) rejection of VanEck’s Bitcoin exchange-traded product that aimed to track Bitcoin’s spot price.
This negative development was, however, quickly overshadowed by the successful activation of the Taproot soft fork on November 13. The Taproot soffork upgrade is expected to improve the Bitcoin blockchain network’s privacy, efficiency and smart contracts capability. Hampus Sjöberg, a Bitcoin developer who runs a website dedicated to the Taproot upgrade has termed this activation as the “greatest win” since it has proved that the Bitcoin network can do upgrades, which is important for the longevity and increased utility of the network.
This development is expected to push BTC upwards especially after it has added 1.52% so far on the day.
Bitcoin price faces little Resistance Upwards
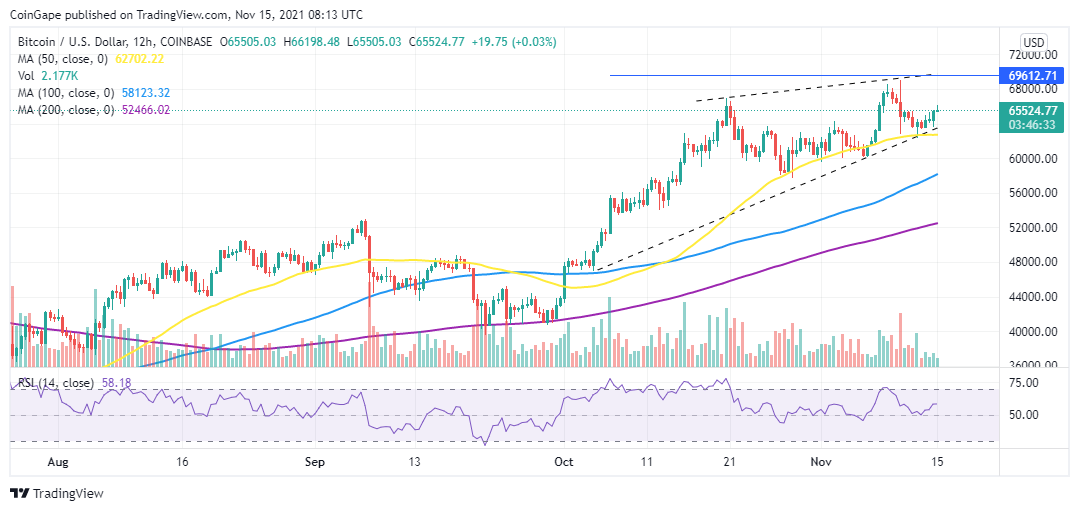
BTC/USD price sits on strong support around $62,702 provided by the 50 SMA in coincidence with the lower boundary of the rising wedge. Bitcoin bulls appear determined as they recapture the recent range highs around $65,500. This appears to have bolstered bulls who aim to overcome the BTC ATH to tag the target of the rising wedge at $69,600, after which discovering new price highs at $70,000 and above will be the next logical move.
The upsloping moving averages and the upward movement of the Relative Strength Index (RSI) away from the midline validates BTC price bullish narrative.
BTC/USD Daily Chart
Moreover, on-chain metrics from In/Out of the Money around Price (IOMAP) model by IntoTheBlock indicate that BTC is sitting on robust support downwards. For example, the support above $63,000 is where roughly 780,650 BTCs were previously bought by around 1.11 million addresses.
Bitcoin IOMAP Chart
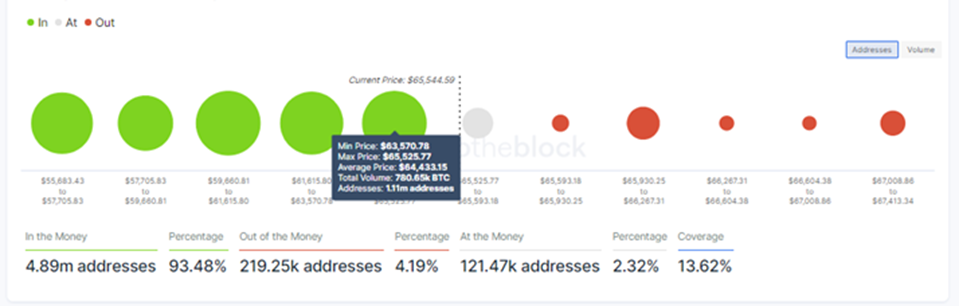
This support is robust enough to absorb any selling pressure threatening to pull the price of the bellwether crypto below this point. The same IOMAP chart shows that the path with the least resistance for BTC is upwards.
On the flipside, things could go awry for the Bitcoin price if sellers enter the scene and pull the price below the immediate support around $63,000.
A decisive bearish breakout below this level will confirm the breakdown of the wedge chart pattern pulling BTC towards the November 6 lows around $60,192. Beyond this level, the next major support wall is around the $57,700 level.