- SAND price has fallen nearly -20% over the last week
- SAND Price has formed a symmetrical triangle
- 45 MA is acting as resistance
Sandbox (SAND) Forms Symmetrical Triangle
The Sandbox (SAND) price has exploded in popularity & users over the last year thanks to the ongoing NFT boom. Virtual artwork, game figures, documents, & much more has grown in great amounts over the last year as more and more people show their interest in the rapidly growing metaverse.
The Sandbox is a blockchain based virtual world that allows users to create, build and sell digital assets in the form of a game. SAND price effectively combines the power of decentralized autonomous organizations (DAO) and NFTs which creates a decentralized gaming platform.
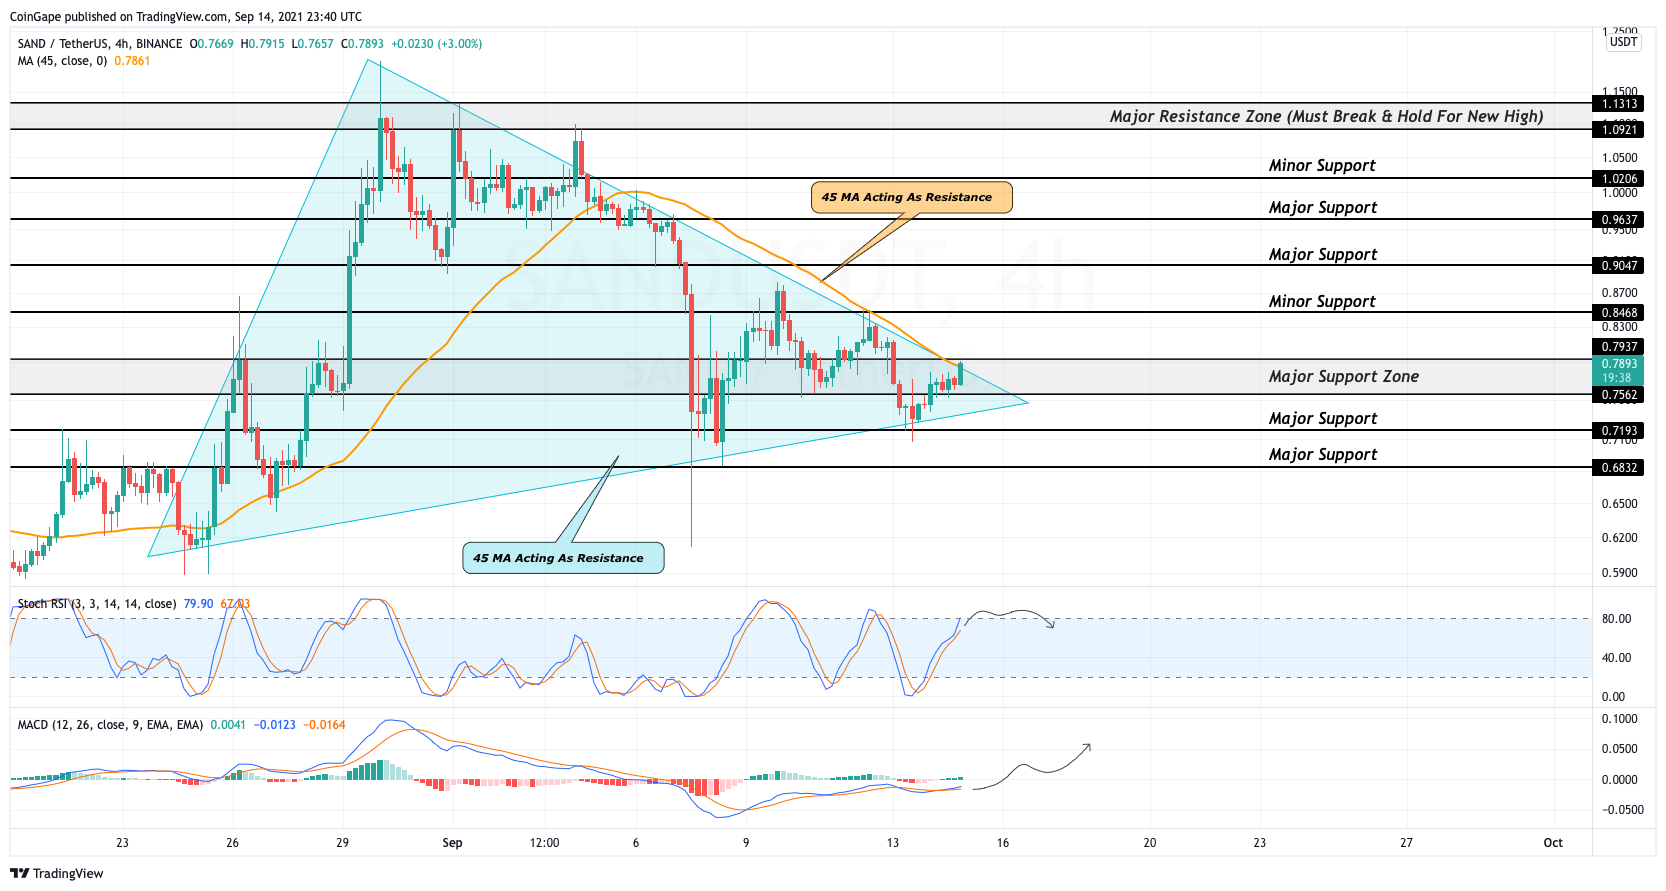
Over the last few weeks, SAND price has formed a wild rainbow-like structure as price pushed over a dollar & then fell to around $0.60. This movement has also formed a symmetrical triangle (shown in blue). Each time price has attempted a breakout of the top trend, it has failed as bears pulled price back into the triangle. Just over the last 4 hours, SAND price has managed to break to the upside of its triangle as it heads towards the major resistance of $0.793.
If bulls manage to hold this mark, expect price to head towards the next minor resistance of $0.846.
The Sandbox Price Analysis: SAND/USDT 4 Hour Chart
If SAND price manages to hold this bullish breakout, price may be on its way back to $1.00. There are many resistance along the way but judging off the movements of other altcoins, SAND price may be in position to break towards a new all time high. Although, we must take note of the potential scenario where this is a false break similar to what happened back on September 4th. If bears assert more control & pull SAND back into its triangle, it must hold its bottom trend or it may be in for another fall to the downside. SAND price must hold its major support of $0.719 or its in for a major fall.
- While looking at the Stochastic RSI, we can see that strength is heading towards the overbought region above the 80 value. If strength continues within this zone, we should expect SAND price to continue this bullish breakout.
- The MACD has been coiling below the 0 value & is primed for a bullish breakout to the upside.
SAND Intraday Analysis
- Spot rate: $0.77
- Trend: Neutral
- Volatility: Medium
- Support: $0.756
- Resistance: $0.793