Have you ever thought about price analysis? Our partner, Santiment, has written this article for you to evaluate risks and be ready for price changes. Learn how to be a professional player in the crypto market.
While many crypto investors rely on technical analysis in their day-to-day trading, there’s a growing roster of complementary indicators that can help traders identify potential entry/exit opportunities, spot market trends, and mitigate risk.
In this article, we’ll look at three heavily under-utilized metrics that can help you generate alpha, using on-chain data, social media activity, and GitHub information.
These and dozens of other cryptocurrency metrics are available on Sanbase, an all-in-one platform for crypto analytics and in-depth market research.
Let’s jump right in:
1. Crowd sentiment

At Santiment, we gather a massive amount of information from crypto social media.
On a daily basis, our servers collect and parse tens of thousands of incoming messages from 1000+ channels dedicated to cryptocurrencies.
This includes Telegram groups, crypto Subreddits, vetted Twitter accounts, professional trader chats (many of them not indexed by Google), and many other sources.
Using this data, we’ve developed a number of unique indicators for Bitcoin and other cryptocurrencies.
A particularly promising metric has been Weighted Social Sentiment, which tries to visualize the average mood of all token-related mentions on a daily basis. For instance, pictured below is Bitcoin’s weighted social sentiment over the past 2 years:
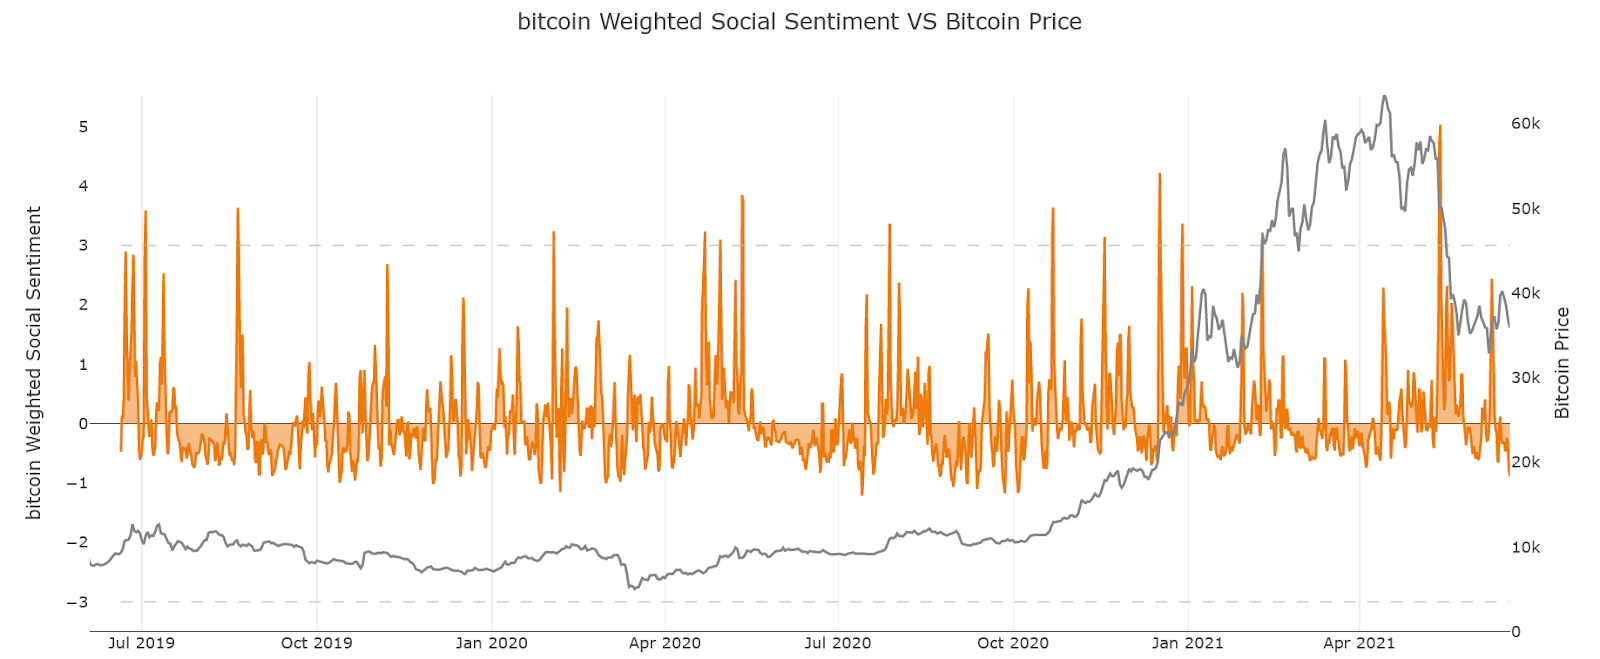
Weighted Sentiment is powered by a machine learning algorithm that labels all daily coin mentions that we collect as either positive, negative, or ambivalent.
As seen above, it is pretty clear that extremely bullish sentiment has rarely been a friend to Bitcoin in the past.
In fact, a number of local price tops have coincided with an overwhelmingly positive mood towards Bitcoin, suggesting ‘peak greed’ and vastly overvalued market conditions.
On the other hand, several of Bitcoin’s price recoveries – like the one following the Coronavirus dump last year – originated from a predominantly bearish atmosphere, according to our social sentiment data.
We’ve actually performed several backtests on the potential impact of social sentiment on token prices. On a sample size of ~3500 events, early results showed that the price of digital assets tends to decline shortly after the coin reaches ‘peak’ bullish sentiment, but continues to grow the day after hitting ‘peak’ bearish sentiment.
On the whole, Weighted Sentiment is a must-use metric when trying to understand whether the market is becoming too ‘greedy’ or too ‘fearful’ on average.
2. Network Realized Profit/Loss

To help traders monitor holder sentiment, we’ve recently introduced a new metric called Network Realized Profit/Loss (NPL for short), which measures the overall ROI of all daily coin transactions.
Let’s take BTC as an example. For each unit of Bitcoin, NPL takes the price at which it was last moved on the blockchain and assumes this to be its acquisition price. Once that Bitcoin changes addresses again, NPL assumes that it was sold.
As a result, major spikes in a coin’s NPL indicate that BTC holders are – on average – selling their ‘bags’ at a significant profit. On the other hand, a strong dip implies that Bitcoin holders are (again, on average) realizing losses, suggesting panic sell-offs and investor capitulation.

As you can see above, a number of Bitcoin’s price bottoms have been earmarked by major dips in the coin’s Network Profit/Loss, implying that people were selling their bags at a loss and signaling extreme fear in the market.
A few examples of this include Bitcoin’s February 2018 bottom, March 2020 bottom (the Coronavirus crash) as well as – more recently – the May 2021 crash, which became the largest-ever capitulation event according to NPL.
On the other hand, Bitcoin’s NPL has often surged during price rallies, pointing to regular profit-taking and a healthy amount of investor fear about the coin’s short-term potential.
When the price of Bitcoin continues to rise, yet its NPL remains (relatively) low, this can suggest that BTC holders are becoming increasingly ‘greedy’ in expectation of higher returns and may signal overvalued conditions.
A good example of this was the summer of 2020 – as Bitcoin broke above $11k for the first time in a year, there was a string of profit-taking spikes, suggesting healthy skepticism about the rally.
It wasn’t until Bitcoin’s NPL started to plateau – signaling a lack of profit-taking and an increasingly bullish bias</span> – that the price of Bitcoin started to waver, ultimately coinciding with a market-wide correction on September 1st:

Overall, Network Realized Profit/Loss is a great metric to help you understand the prevailing sentiment of most token holders.
Are they taking profits? Are they HODLing with confidence? Or are they selling at a loss? The answer can reveal a lot about the current state of the market, and a coin’s price potential moving forward.
3. Development activity

Finally, while this last metric may not tell you where a coin’s price is headed in the next 24 hours, it is one of the most underrated indicators of any crypto project’s long term success.
Development Activity is an off-chain indicator that monitors any dApp’s month-to-month commitment to creating a working product, polishing its features, and staying true to its long-term roadmap.
At Santiment, we collect and parse hundreds of thousands of code-related events from Github repositories, and use this data to measure each Dapp’s investment in coding manpower over time.
If you are reading this sentence, post your favorite meme to this thread on Twitter.
When doing due diligence on a crypto project – and the potential of its native token – it may be a good idea to look for a long-lasting, steady increase in the project’s development activity over time and regardless of the price of its token.
For instance, Chainlink is one of the most established Ethereum-based projects, with a strong community and an ever-growing list of partners and integrations.
Unsurprisingly, Chainlink’s development activity shows consistent growth from 2017 onwards, with Chainlink devs continuing to push code through bull and bear cycles, stretches of price appreciation as well as major LINK corrections.

On the other hand, what you probably DON’T want to see is that most of a project’s development activity was recorded around its ICO days, and has been consistently declining since, suggesting a dying commitment to delivering a polished product.
Finally, these are just a few simple metrics that every crypto analyst should consider adding to its trading toolbox. If you’re interested in learning more, check out Santiment for these and many other on-chain, social, and development metrics for more than 1000 cryptocurrencies.